Black carbon are produced from incomplete combustion of fossil fuels and bio-fuels used by anthropogenic activities as well as open biomass burning, and it plays important roles in global climate, regional environment and human health. Combined with in-situ black carbon (BC) measurement and a regional dynamics and aerosol model (WRF-Chem), the impacts of local emission, meteorological conditions, and regional atmospheric transport on seasonal variation of BC concentration in the Guanzhong region were quantified. The results show that the regional prevailing winds in the Guanzhong region were extremely adverse to the horizontal transport of BC particles. During spring and autumn, there was a wind convergent zone in the Guanzhong region, constraining the BC concentrations inside the region. In winter, the wind in the region was very weak (~1.0 m/s) while in summer, a moderate easterly is favorable for BC transport from the east to the west. The model sensitivity study shows that the seasonal variation of BC concentration was largely due to the seasonal variation of BC emission, and local emission contributed more than 70% to BC concentration in winter. Besides the emission, seasonal variation of meteorological conditions led to the difference of BC concentration of 10 μg/m3 between winter and summer.
This study provides helpful scientific knowledge for improving air pollution in the Guanzhong region, and reducing local BC emission, especially controlling the emission in winter, will be an effective way to decrease BC concentration in the region.
Click this link for the paper:
http://dx.doi.org/10.1016/j.atmosenv.2015.05.008
 |
 |
|
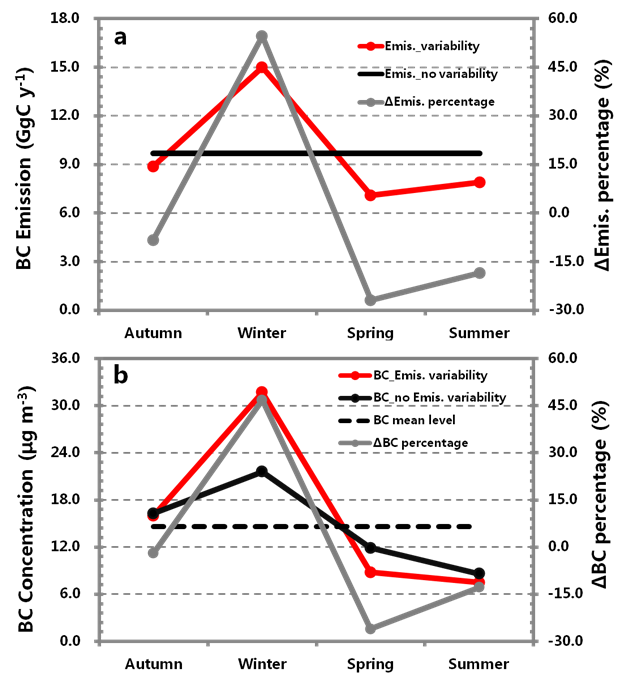
Fig.1 (a) Seasonal variability of BC emission (the red solid line) and the annual mean level (the dark solid line), and the percentage of seasonal variation of BC emission was calculated as following:ΔEmis. percentage = (Emis._variability – Emis._no variability)/ Emis._no variability * 100%(the grey solid line); (b) Seasonal variation of BC concentration with (the red solid line) and without (the dark solid line) seasonal variability of BC emission, and the dark dash line for the annual mean BC concentration without seasonal variability of BC emission, while the grey solid line for the percentage of BC concentration increment that was calculated as following:ΔBC percentage = (BC_Emis. variability – BC_ no Emis. variability)/ BC_ no Emis. variability * 100%. |
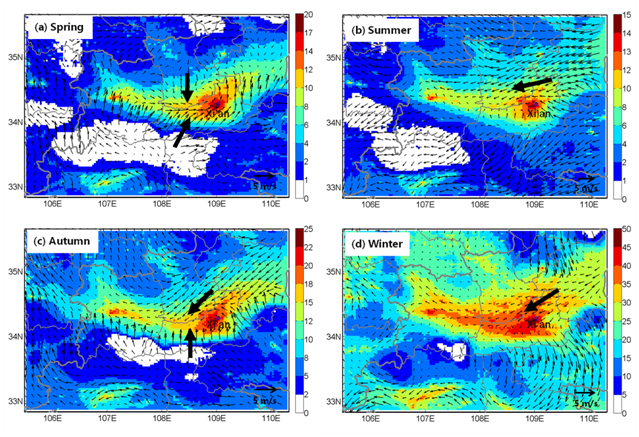
Fig.2Seasonal distributions of BC concentration (unit: μg m-3) and horizontal winds in the Guanzhong region. |
